PEP is a core holding in our Top 20 Dividend Stocks portfolio because of its extremely safe dividend (94 Safety Score), above average dividend growth prospects (58 Growth Score), and reasonable dividend yield (2.8% yield is in the 56th percentile of all current dividend yields). The stock was added to the portfolio on 7/10/15 at a price of $95.55 (the stock closed at $99.23 on 8/14/15).
Business Overview
PEP is a global food and beverage company that grossed nearly $67 billion in sales last year, including $1 billion or more from 22 of its largest brands (Frito-Lay, Gatorade, Pepsi-Cola, Quaker, Tropicana, and more). A little over 50% of sales are in North America, which is split roughly 50/50 between snacks and beverages. In general, snacks carry higher margins than beverages.
Stock Performance
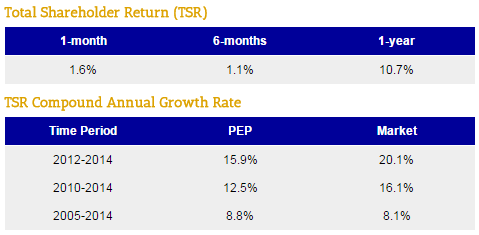
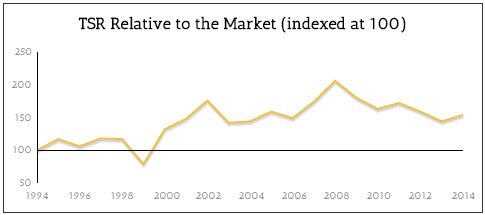
PEP has performed well over the last year, returning 11%. However, the stock has not quite kept up with the overall market over the last 3- and 5-year periods, trailing by several percentage points but still generating nice absolute returns. The weaker performance coincides with a slowdown in revenue growth, which saw total reported sales decline 2% in FY12, rise 1% in FY13, and remain roughly flat in FY14.


Dividend Analysis
We analyze 25+ years of dividend data and 10+ years of fundamental data to understand the safety and growth prospects of a dividend. PEP’s long-term dividend and fundamental data charts can all be seen here.
Dividend Safety Score
Our Safety Score answers the question, “Is the current dividend payment safe?” We look at factors such as current and historical EPS and FCF payout ratios, debt levels, free cash flow generation, industry cyclicality, ROIC trends, and more.
PEP scored a very high Safety Score of 94, meaning its dividend is safer than 94% of all other dividend stocks.
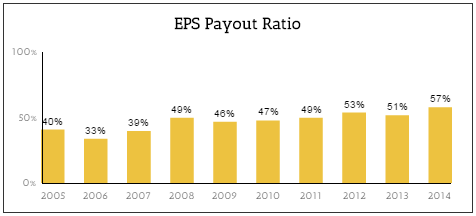
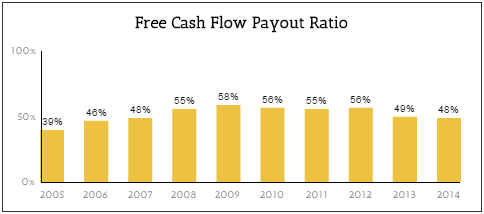
As seen below, PEP has maintained EPS and FCF payout ratios between 40-60% over the past decade, suggesting there is reasonable cushion to continue paying and growing the dividend, even in the event of an unexpected decline in the business.


Like many other consumer staples businesses, most of PEP’s products are in slow-moving industries and benefit from recurring consumer demand, adding further stability to the business and dividend. To reinforce this point, PEP’s sales grew 10% in fiscal year 2008 and were roughly flat in fiscal year 2009. Perhaps even more impressive, free cash flow per share has grown every single year since fiscal year 2006. Talk about durability!
Unlike some of its salty snacks, PEP’s balance sheet is healthy. As seen below, the company generated $7.8 billion in free cash flow last year, equivalent to over half of the company’s net debt of $13.5 billion. Other credit metrics look really good, too – net debt / EBIT is a low 1.4x, and interest coverage (EBIT / Interest Expense) exceeds 10x. PEP’s balance sheet and free cash flow generation further support the safety of its dividend.

Dividend Growth Score
Our Growth Score answers the question, “How fast is the dividend likely to grow?” It considers many of the same fundamental factors as the Safety Score but places more weight on growth-centric metrics like sales and earnings growth and payout ratios.
PEP’s Growth Score is 58, placing it in the top half of the 2,700+ dividend stocks we monitor for forward-looking dividend growth prospects.
As seen below, PEP has grown its dividend at an 11% annual clip over the past decade and increased its dividend by 13% and 6% in 2014 and 2015, respectively.

Yield Score
Our Yield Score simply ranks a stock’s current dividend yield against all of the other dividend yields in the market. A score of 50 means the stock’s yield is right in the middle of the pack. A score of 100 means it has the highest yield.
PEP’s Yield Score is currently 56, placing it approximately in line with the market’s average dividend yield. I view this favorably because, unlike the “average” stock in the market, PEP is a much higher quality business with arguable above average growth prospects going forward.
Competitive Strengths
PEP is truly a fantastic business. $100 invested in PEP in 1965 would be worth nearly $43,000 today with dividends reinvested. That type of growth cannot occur unless a company is doing something right (or getting extremely lucky…for decades at a time). So, why has PEP been such a chugger, and can this type of persistent growth persist?
To Read the Full Analysis, Subscribe or Sign In


Leave A Comment